Tokyo Olympics Data Engineering and Analysis using Microsoft Azure


This project deals with Tokyo Olympics 2021 dataset. This project involves understanding the data architecture, creating the ETL pipeline, and finally analysing the data. The project is based off Darshil Parmar video on YouTube. This contains the details of over 11,000 athletes, with 47 disciplines, along with 743 Teams taking part in the 2021(2020) Tokyo Olympics. This dataset contains the details of the Athletes, Coaches, Teams participating as well as the Entries by gender. It contains their names, countries represented, discipline, gender of competitors, name of the coaches.

There are 5 datasets from which the data was extracted to perform analysis.
Athletes data: The file contains all athletes data. Columns: Name, Name of Country (NOC) and Discipline
Coaches data: The file contains coaches names. Columns: Name, Name of Country (NOC), Discipline and Event
Entries Gender data: The file contains males and females data. Columns: Discipline, Female, Male and Total
Medals data: The file contains ranks and all the three medals. Columns: Rank, Team/NOC, Gold, Silver, Bronze, Total, Rank by Total
Teams Data: The file contains all the teams. Columns: Name, Name of Country (NOC), Discipline and Event
First, we focus on the data architecture. This architecture helps us understand the ETL(Extract, Load, Transform) pipeline and when the data is ready to derive insights from it.

This is the data architecture followed when you are extracting data from a source using azure. This can be broken down into three major steps.
Data Ingestion
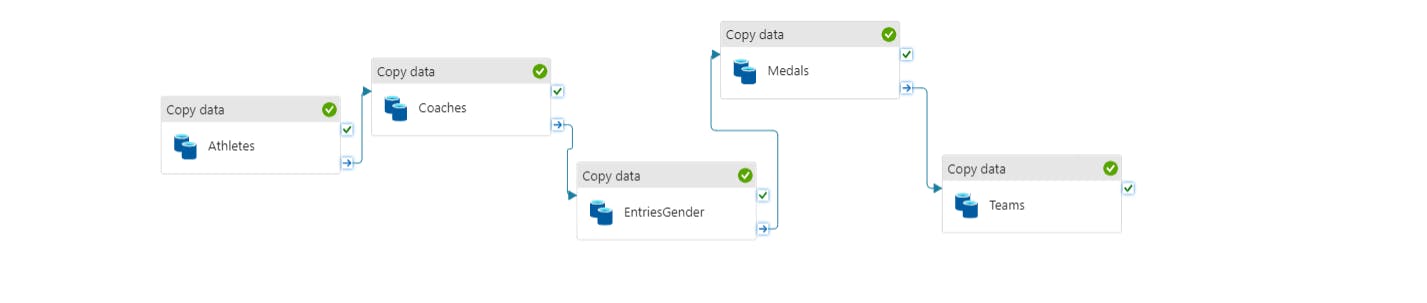
In this step you extract the data from the the GitHub as a source using Azure Data Factory tool, building a data flow and loading it into Azure Data Lake storage Gen 2.
Data Transformation in Azure Databricks
In Azure Databricks, you write the code in Python to read the data stored in the Azure data lake, perform the transformations and then load the data back to Azure data lake Gen 2. This new data is the new processed data.

After you make the transformations, you then store the new data here:


Data Analysis
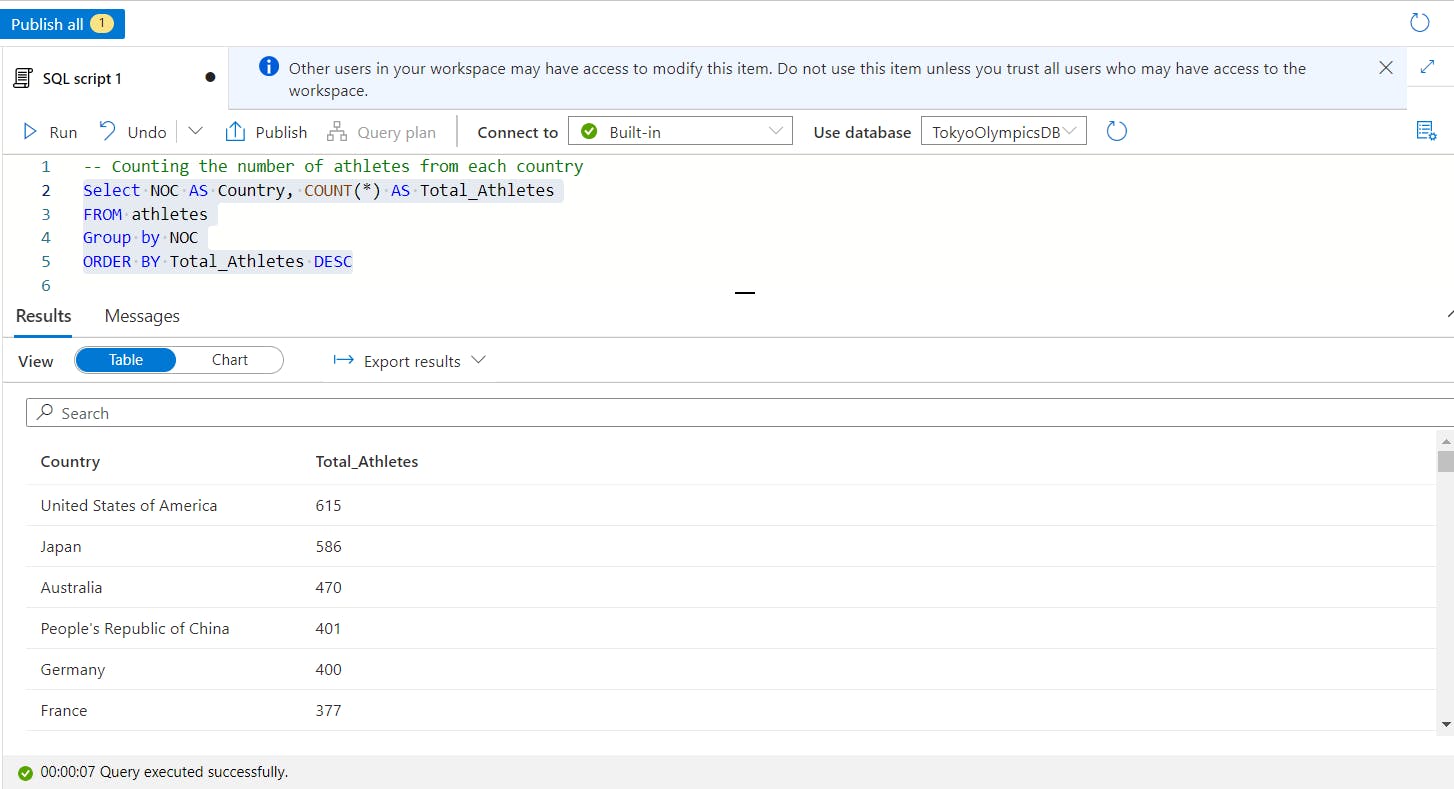
The final step involved is to analyze and derive important insights from this data using SQL.
Calculating the total number of athletes from each country
Total number of athletes by discipline in India

At last you can visualize these data in the form of charts and graphs:
